


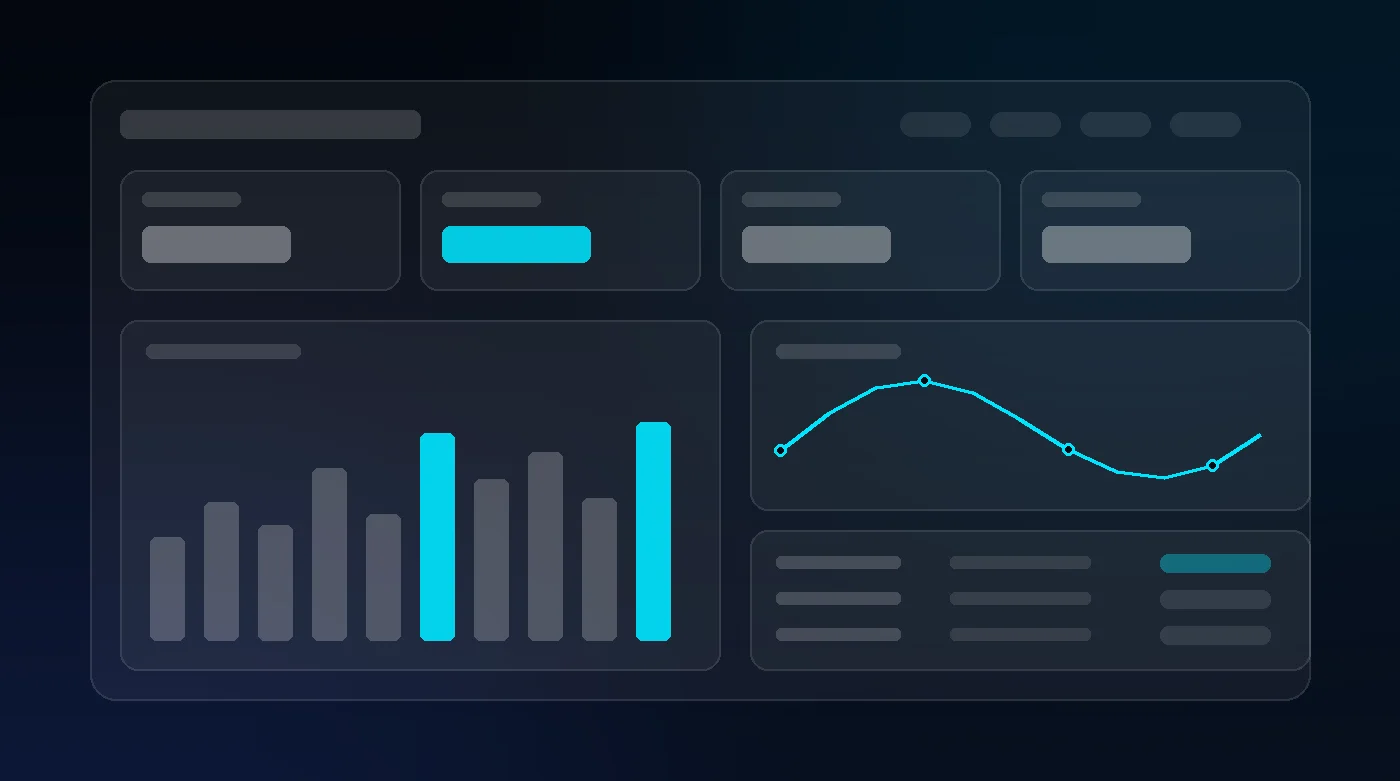
Dashboards & Data Systems
Live operational dashboards and data pipelines that put sales, operations, and finance numbers in one place, built from your own systems.
// Overview
We define the KPIs with your team, then build data pipelines from your CRM, ERP, spreadsheets, and databases into dashboards that work in Arabic and English with RTL layouts, role-based access, and alerts.
// How This Helps You
- Numbers that update themselves instead of weekly spreadsheet assembly
- One agreed definition for every KPI
- Exceptions flagged early by alerts
- The same data in Arabic and English, in the right direction
// What's inside
Everything that powers this service
KPI design
Agrees the few numbers that matter and how each one is defined, before anything is built.
Data pipelines
ETL / ELT from CRMs, ERPs, spreadsheets, and databases into one clean store.
Live dashboards
Operational screens that refresh from source systems, in Arabic and English with RTL layouts.
Role-based views
Leadership, operations, and finance each see the slice they need, with access control.
Drill-down & filters
Move from a headline number to the records behind it.
Alerts & scheduled reports
Threshold alerts and scheduled summaries to email, Slack, or Teams.
Data quality checks
Validation and reconciliation so the numbers can be trusted.
Embedded & custom UIs
Dashboards inside your own portal or app when off-the-shelf BI does not fit.
For your company
- Replace weekly spreadsheet assembly with numbers that update themselves
- Give leadership one agreed definition of each KPI
- Spot exceptions early with alerts instead of month-end surprises
- Show Arabic and English users the same data in their own language and direction
- Keep sensitive numbers behind role-based access
For your customers
- Numbers they can trust and trace back to the source
- Answers in seconds instead of waiting for a report
- A clear view in their own language, on any device
- Fewer meetings spent reconciling versions of the truth
// Compared
Spreadsheet reporting vs. a live dashboard
| Spreadsheet reporting | Live dashboard | |
|---|---|---|
| Freshness | Stale by the time it is shared | Refreshes from source systems |
| Definitions | Every team calculates its own | One agreed definition per KPI |
| Exceptions | Found at month end | Flagged by alerts |
| Access | Files emailed around | Role-based views |
| Languages | Usually English only | Arabic and English, RTL-ready |
// How we deliver
From kickoff to launch
Discovery & KPI definition
Agree the questions the dashboard must answer, and the definition and source of each KPI.
Data audit & pipeline design
Check the quality of each source and design the extract-and-transform path.
Build & connect
Build the pipelines and screens and connect them to the source systems.
Validate with real data
Reconcile the numbers against your current reports and fix the differences.
Launch & handover
Go live with access rules, alerts, and documentation for your team.
// Tools & stack
// Start Your Project
Ready to build Dashboards & Data Systems?
Tell us about your project and a senior engineer will be in touch within one business day.
// Other Services
All servicesFrequently asked questions
- What is a custom dashboard?
- A dashboard is a screen that pulls live figures from your systems, such as your CRM, ERP, spreadsheets, and databases, and shows the few numbers your team has agreed on. A custom dashboard is built around your own definitions, roles, and languages instead of a generic template.
- When do I need a custom dashboard instead of an off-the-shelf BI tool?
- Off-the-shelf tools fit when your data sits in supported sources and standard charts are enough. A custom build makes sense when you need Arabic and English with full RTL layouts, dashboards embedded in your own portal, unusual data sources, or tight role-based access.
- Which systems can the data come from?
- CRMs such as HubSpot, Salesforce, and Zoho, ERPs such as Odoo and SAP, spreadsheets, and SQL databases, through their APIs or exports. Feasibility is confirmed in a data audit before any build starts.
- Can the dashboard work in Arabic?
- Yes. Labels, number formats, dates, and layouts are built for both Arabic and English, including full right-to-left layouts, rather than mirrored afterwards.
- How long does it take and what does it cost?
- It depends on the number of data sources, the number of KPIs, and whether the data needs cleaning first. We scope it after a discovery call and give a written estimate; there is no fixed price list.